PRI plot
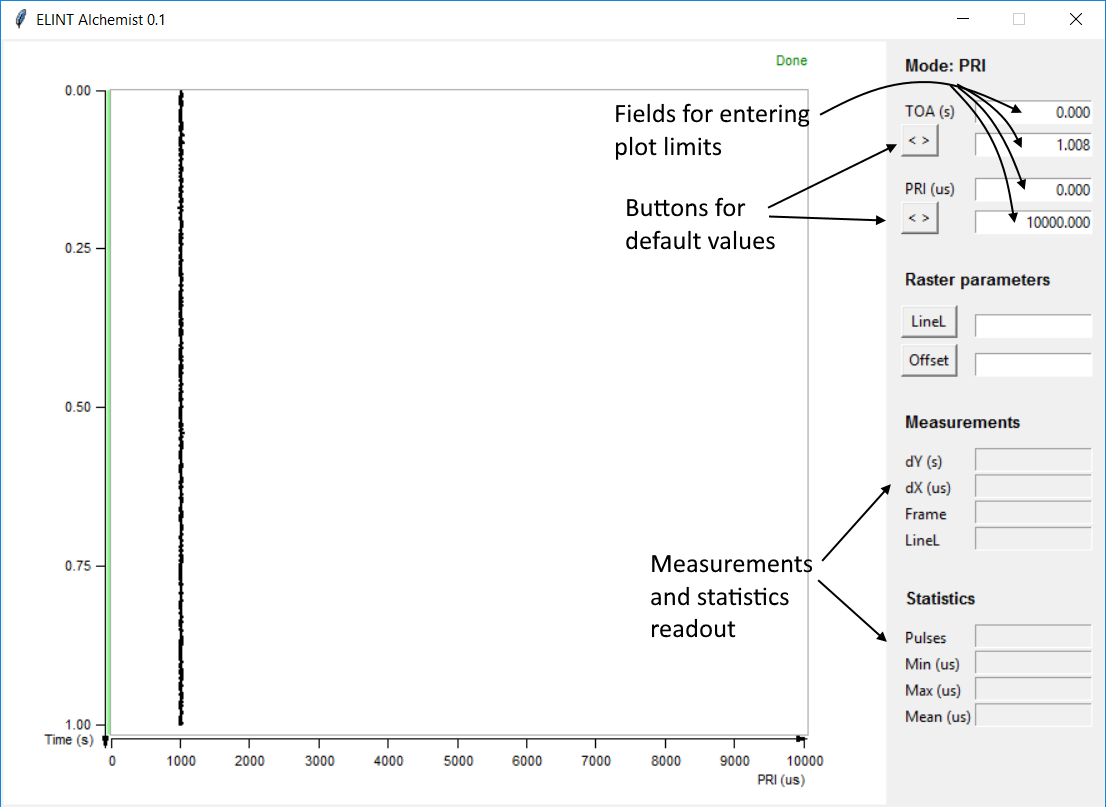
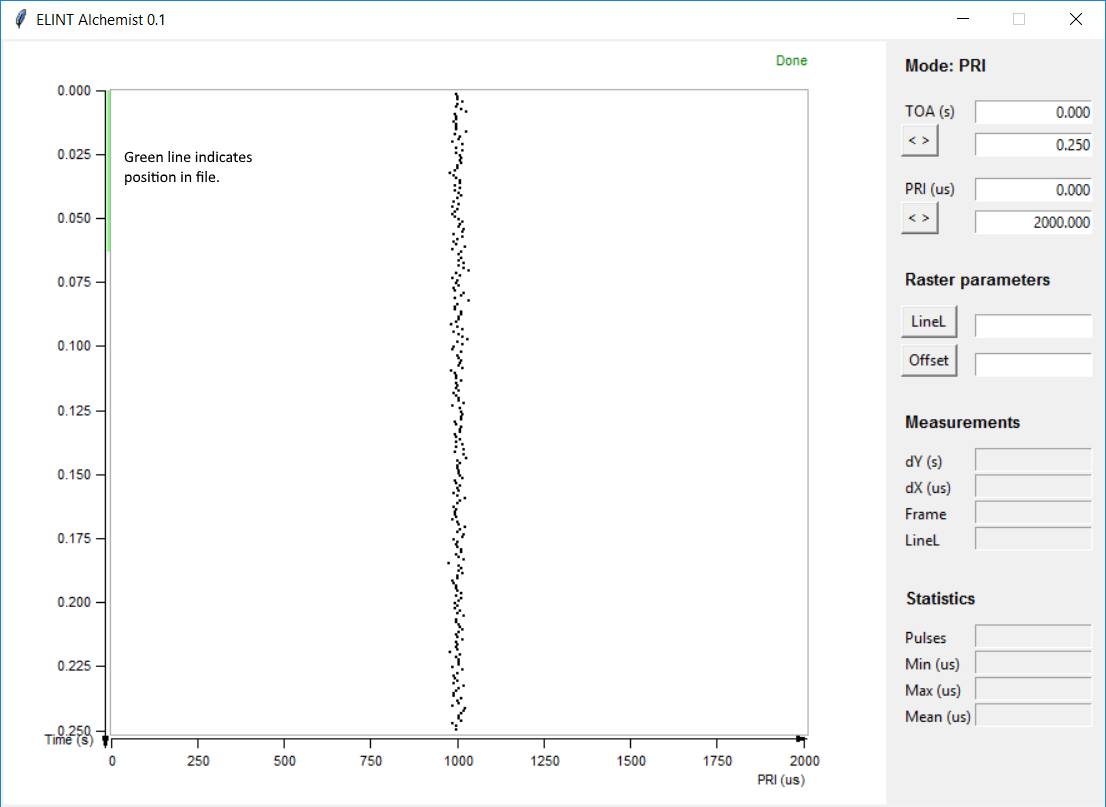
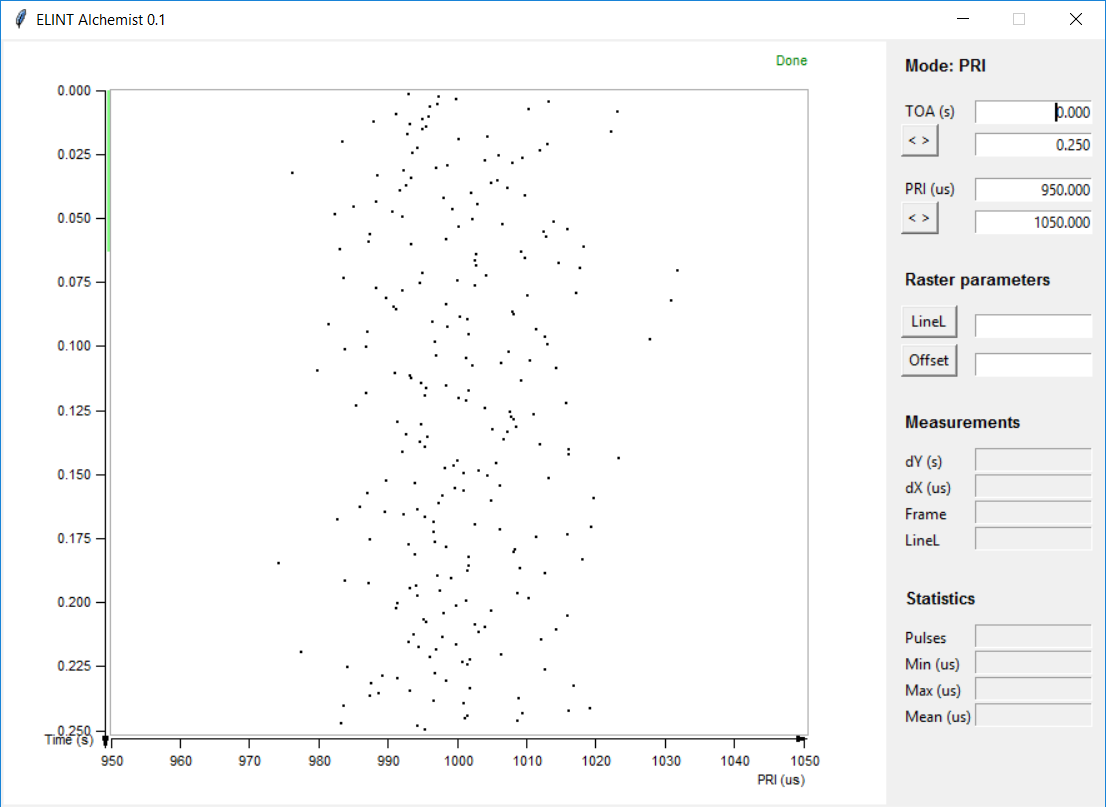
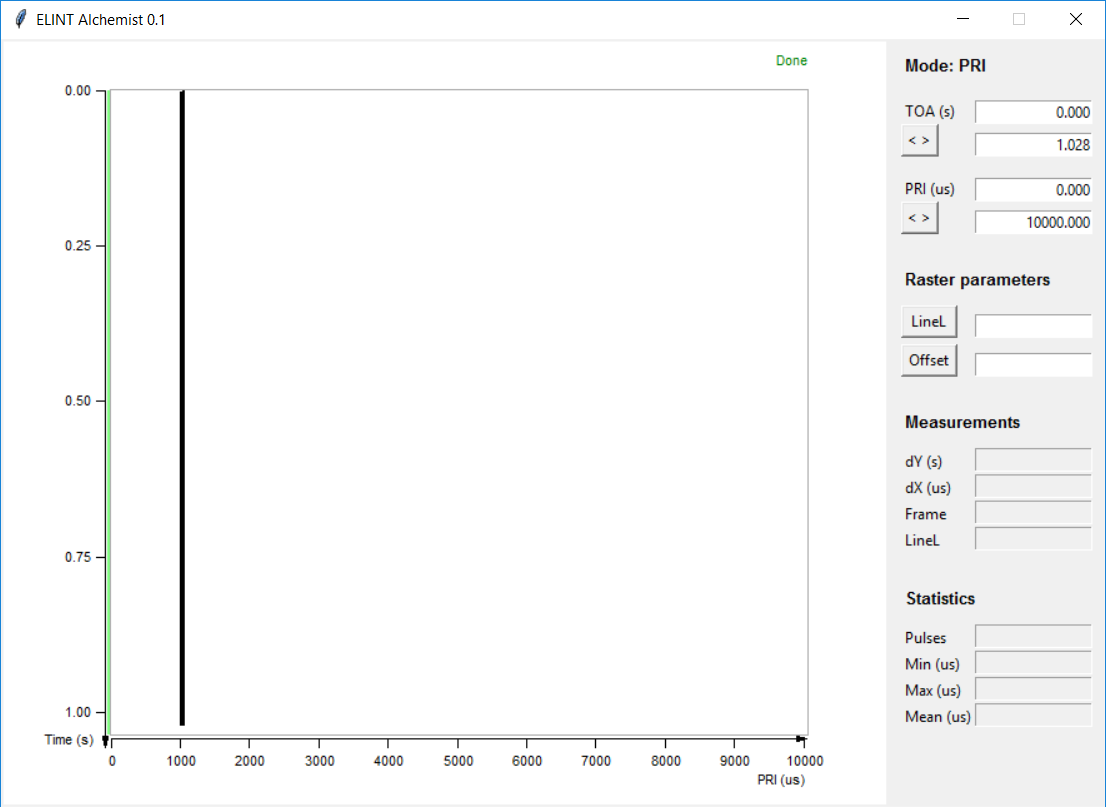
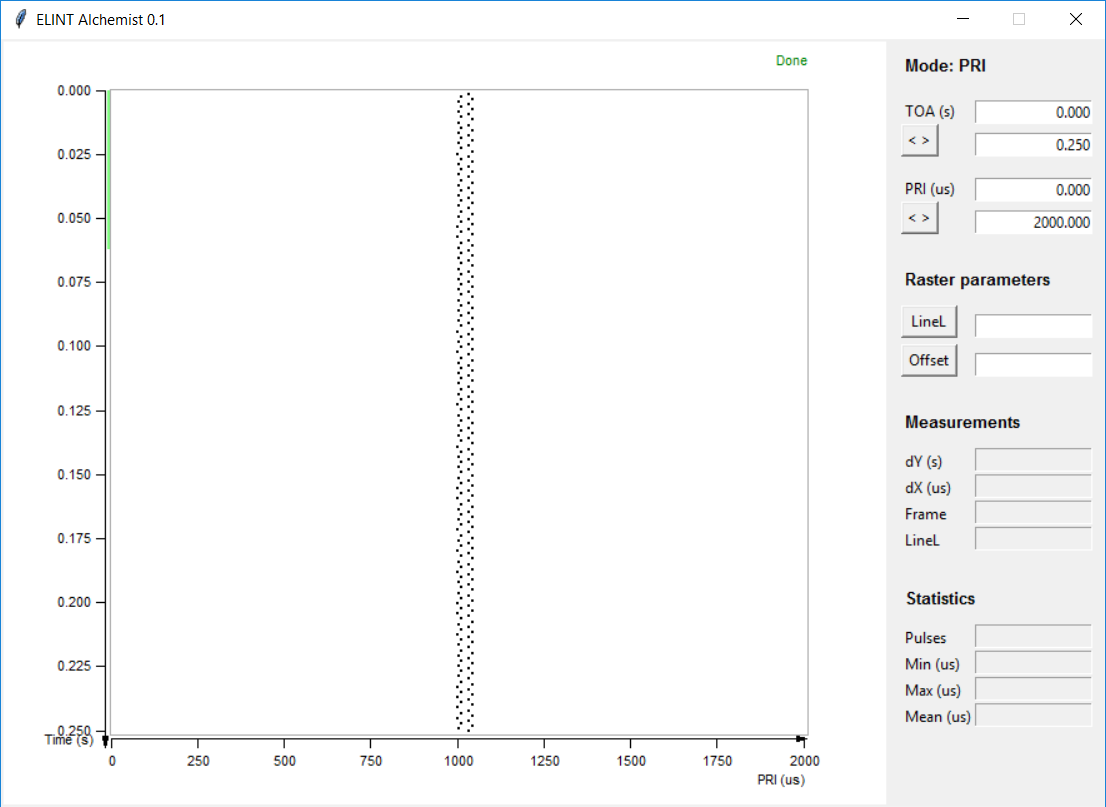
PRI plot of constant unstable PRI with different levels of zoom.
Note the different scales for time and PRI, the second and third plots are of the same file section with different PRI zoomlevels.
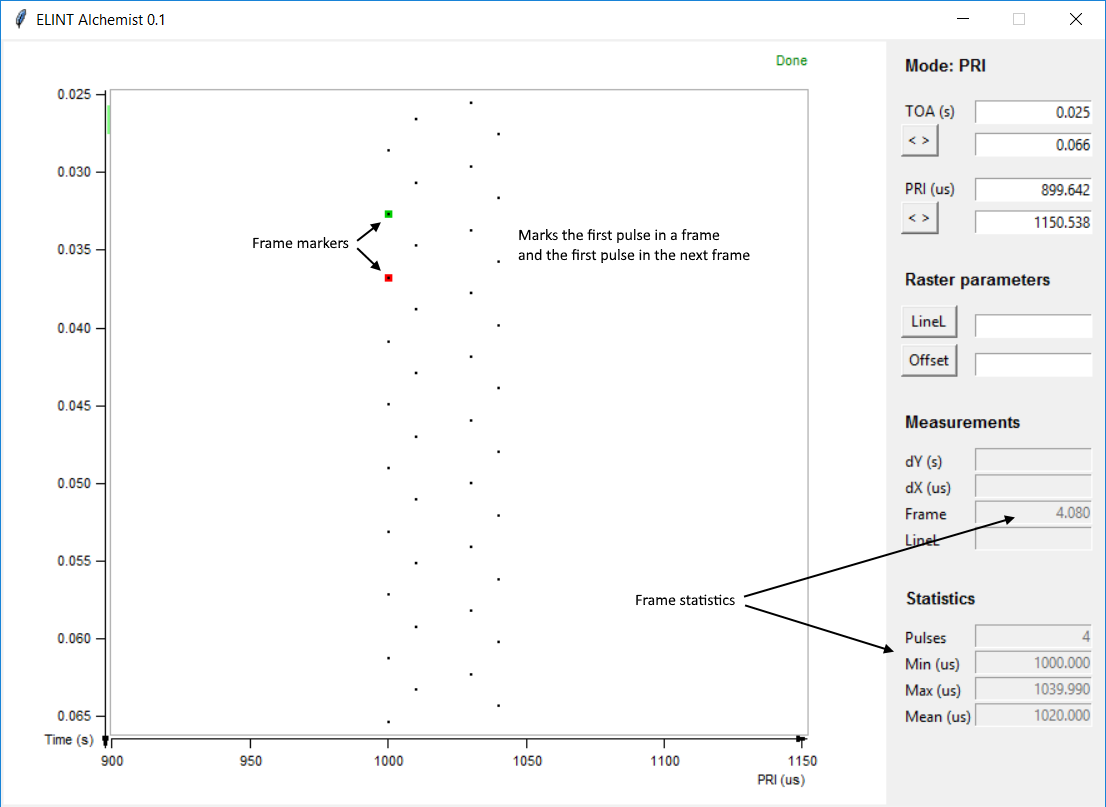
PRI plot of staggered PRF with different levels of zoom. In the third plot I have entered frame markers and statistics.
Raster plot
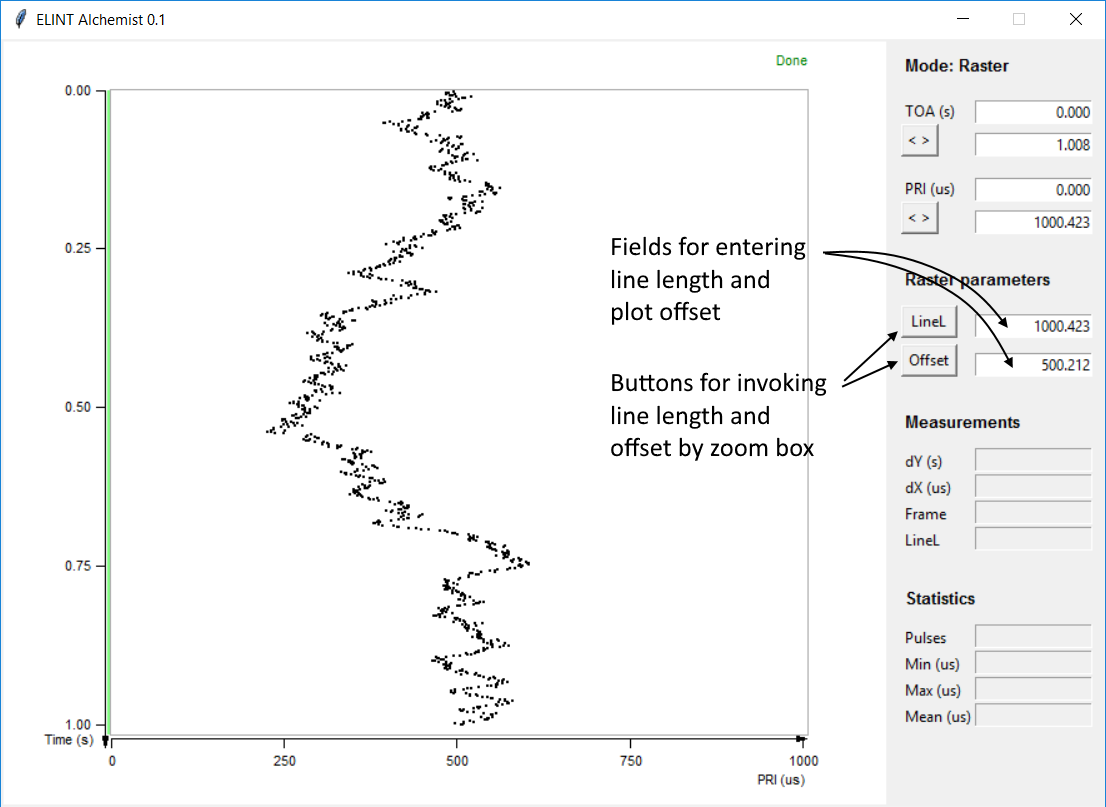
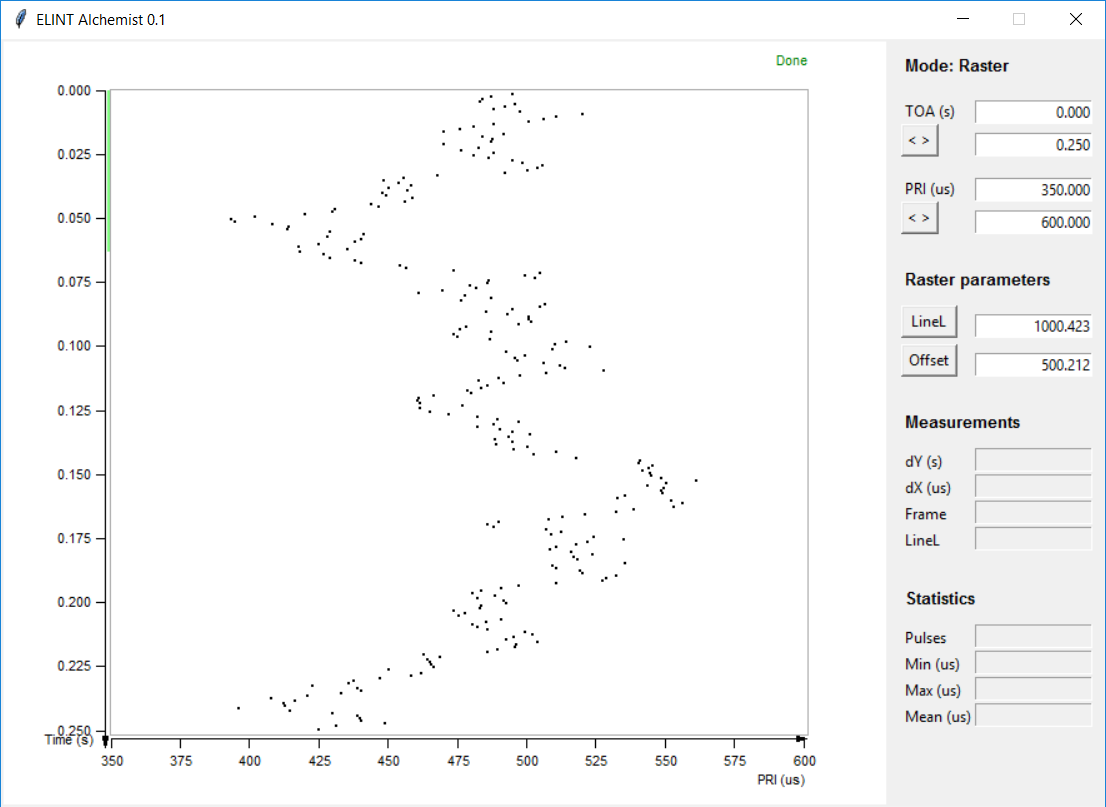
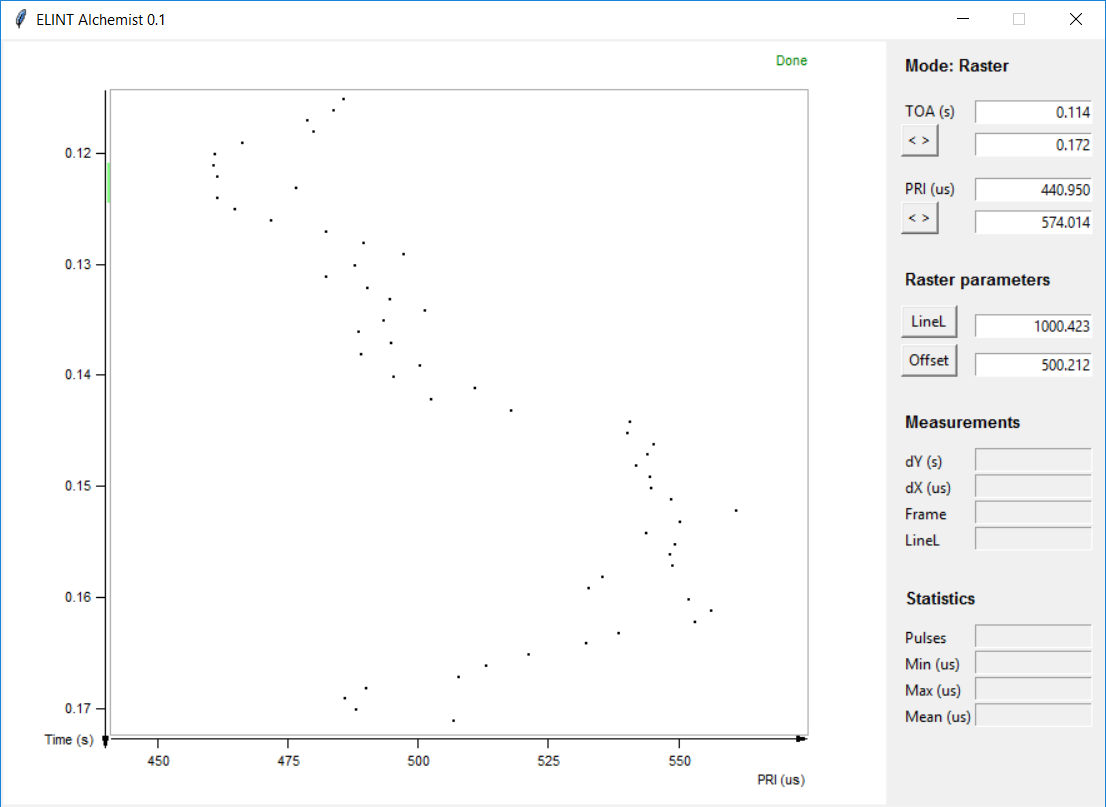
Raster plot of constant unstable PRI with different levels of zoom.
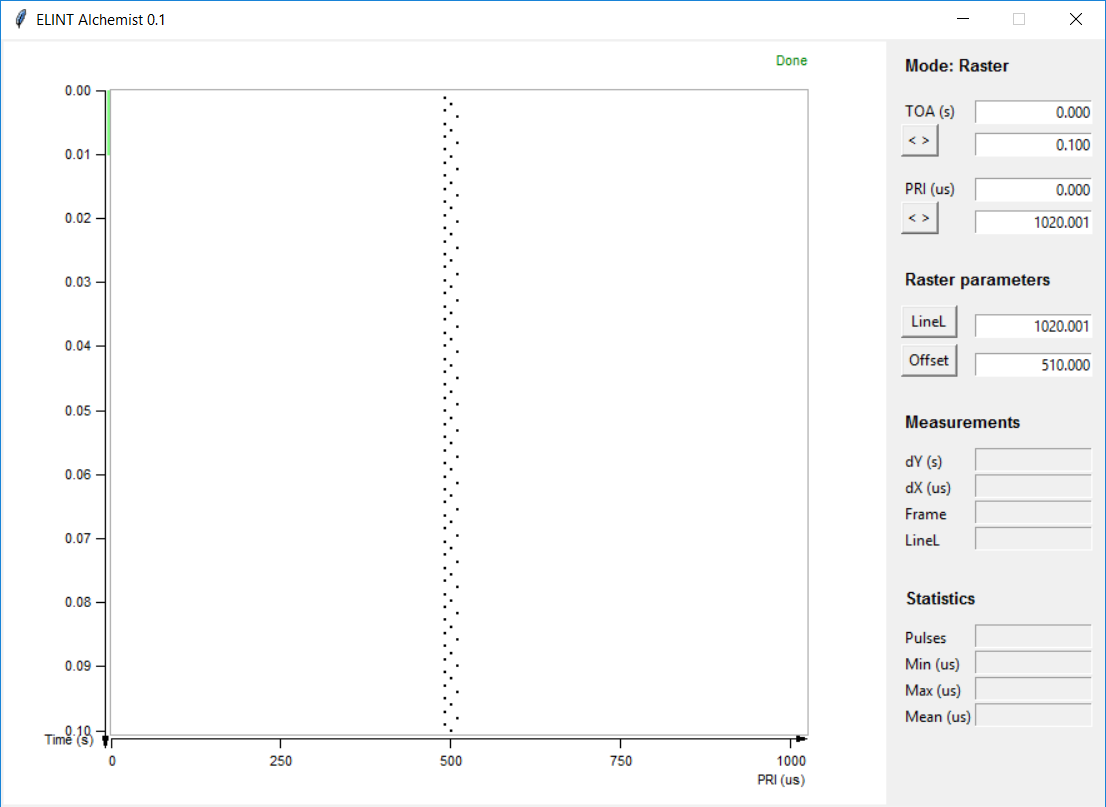
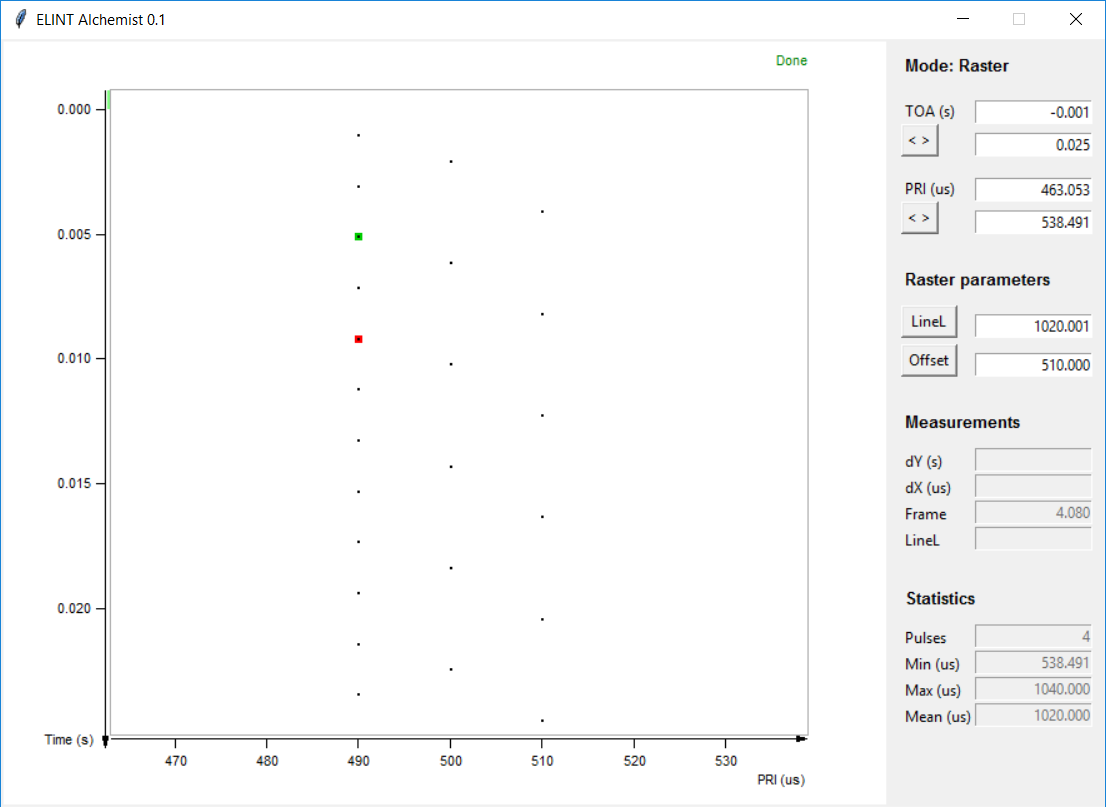
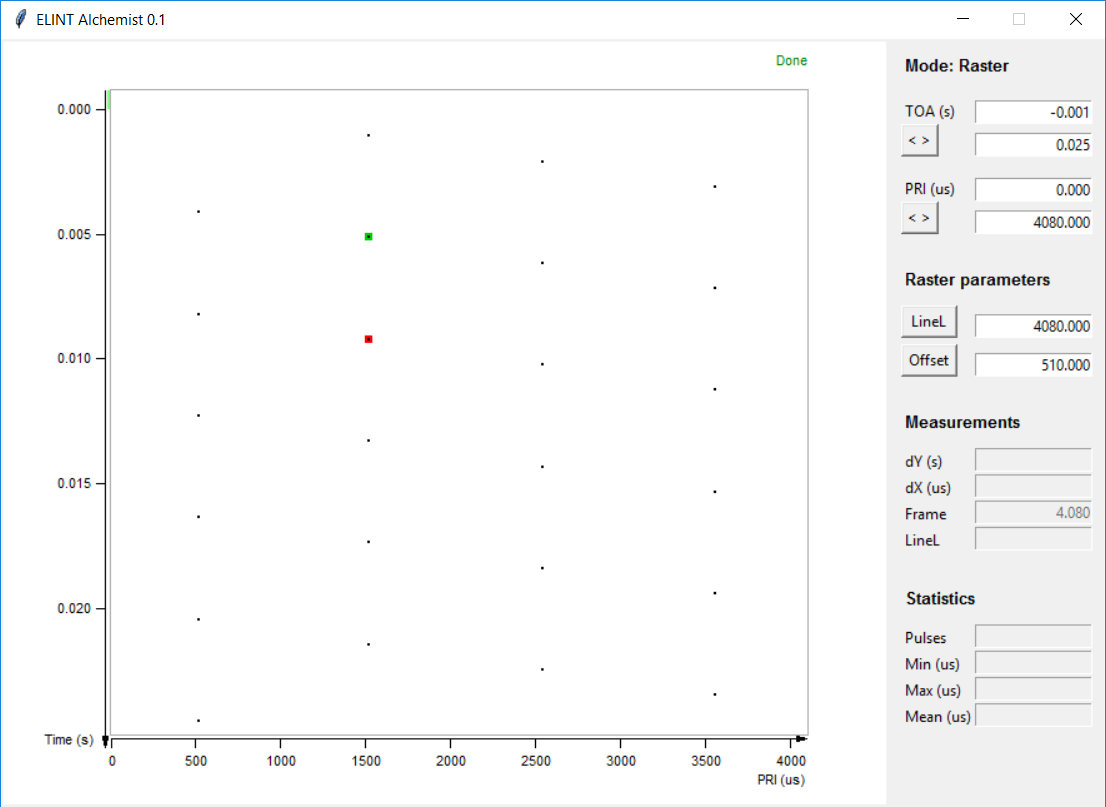
Raster plot of staggered PRF with different levels of zoom. In the second plot I have entered frame markers and statistics. In the third plot I have set the line length to the frame length.
Pulse list
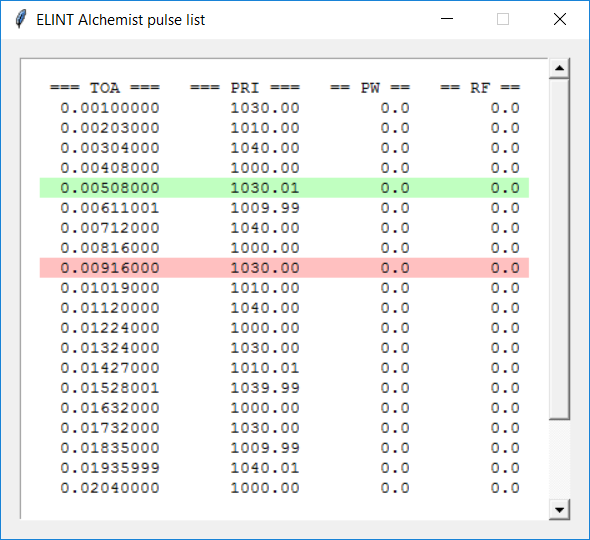
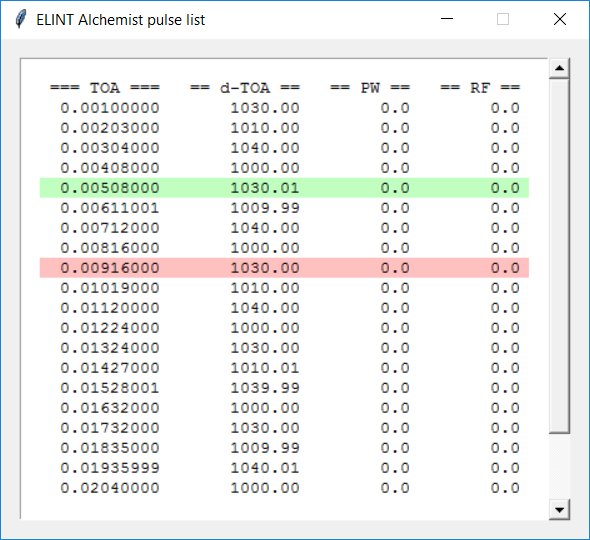
Pulse list, first invoked from PRI plot, then from Raster plot. Notice PRI plot lists PRIs and Raster plot lists delta-TOA. Frame markers are indicated in the lists.
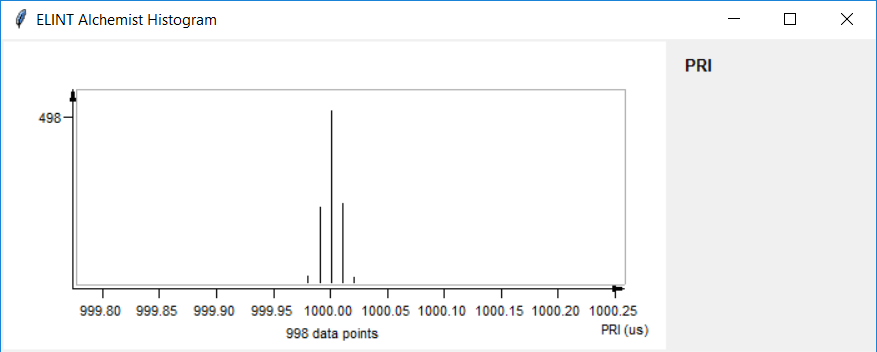
Histogram
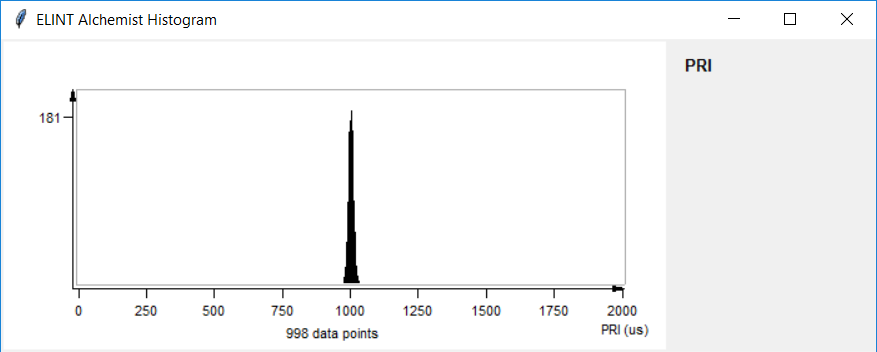
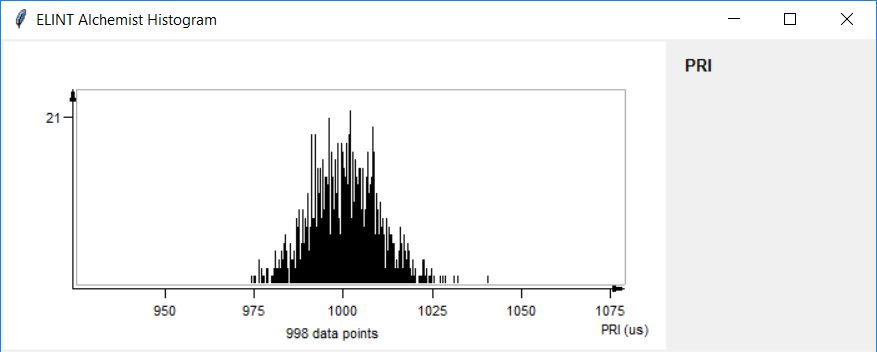
Histogram of constant unstable PRI with different levels of zoom. The third histogram is of constant stable PRF zoomed to maximum limit.
2018-01-02
